 https://lapisit.com.au/wp-content/uploads/2023/07/eea-dashboard-main-screen.png
933
1916
Jeff Dowsing
https://lapisit.com.au/wp-content/uploads/2021/08/LapisLogo-Header-300x138.png
Jeff Dowsing2023-07-17 14:46:262023-11-29 14:56:32Economic-Environmental Accounts Dashboard
https://lapisit.com.au/wp-content/uploads/2023/07/eea-dashboard-main-screen.png
933
1916
Jeff Dowsing
https://lapisit.com.au/wp-content/uploads/2021/08/LapisLogo-Header-300x138.png
Jeff Dowsing2023-07-17 14:46:262023-11-29 14:56:32Economic-Environmental Accounts DashboardThe Challenge
Informing community, commercial and government stakeholders
Environmental-Economic Accounts, known as EEA, is a system of accounts that provides information on the interrelationships between the environment and the economy. It helps measure the economic impact of environmental policies and natural resource use, as well as the contribution of the environment to the economy.
EEA provides a framework for understanding the environmental consequences of economic activity and the economic consequences of environmental degradation. When applied in a consistent and rigorous manner it’s a valuable tool for policymakers, businesses, and individuals to make informed decisions about environmental sustainability and economic growth. It covers not only the financial value of the environment but also the ecosystem services it delivers, including protection of assets and contribution to carbon sequestration.
Australia, a leading framework proponent, has produced non-experimental water and energy accounts since 2009. The EEA Dashboard sought to build on the Australian Bureau of Statistics’ already substantial publishing efforts and other government and non-government parties, to create a new, world-leading EEA data experience.
The Department of Climate Change, Energy, the Environment and Water (DCCEEW) engaged ThinkPlace and Spatial Vision to design and develop the EEA Dashboard and create the foundations for a powerful information asset to be developed over time. The Dashboard had to be designed, developed and delivered in a short timeframe to coincide with the next release of EEA account data by the ABS.
It was critical the Dashboard preserved data integrity whilst presenting it in an innovative, accessible, useful and engaging range of formats and presentations for a wide variety of stakeholders. As such, a series of consultations with the ABS and other contributors to the EEA Accounts creation was undertaken to understand the account data in detail, and in particular, the various sources, tools and techniques used in its creation.
Engage diverse stakeholders with custom tech.
The Approach
Collaborative co-design
The project’s many stakeholders had been contributors to the development of the EEA data, including DCCEEW, the ABS, Geoscience Australia, Digital Earth Australia, the Murray Darling Basin Authority, and a wide range of universities, environmental science research groups, natural capital specialists, standards bodies and Australian governments.
DCCEEW led the framing of the challenge and worked closely with ThinkPlace and Spatial Vision. ThinkPlace led the co-designing of the dashboard concept, capturing user stories and developing the functional and experience design of the Dashboard. Meanwhile, Spatial Vision led the technical and data design and undertook the development of the web application including its hosting and management.
All statistics published by the ABS, whether demographic, economic, social or environmental are subject to a high degree of rigor and validation. Detailed methodology statements were provided by the ABS to document how data has been processed and derived and to explain any caveats or limitations.
Click on the image to visit the dashboard
Much of the account data was derived from raster data, such as land cover and mangrove canopy cover produced by Digital Earth Australia, or national-scale land use data from ABARES. A key feature of the Dashboard was to implement a dynamic account generation process that created accounts consistent with the ABS accounts, but which were able to be generated in near real-time in response to user requests.
With over 70 national-scale raster datasets to be queried, the design required development of a raster processing engine that used Python and open-source spatial and raster libraries. Results were written to a PostGIS database. Once implemented, extensive validation of the results was undertaken, including by stakeholders such as the ABS.
The Results
A practical and powerful solution
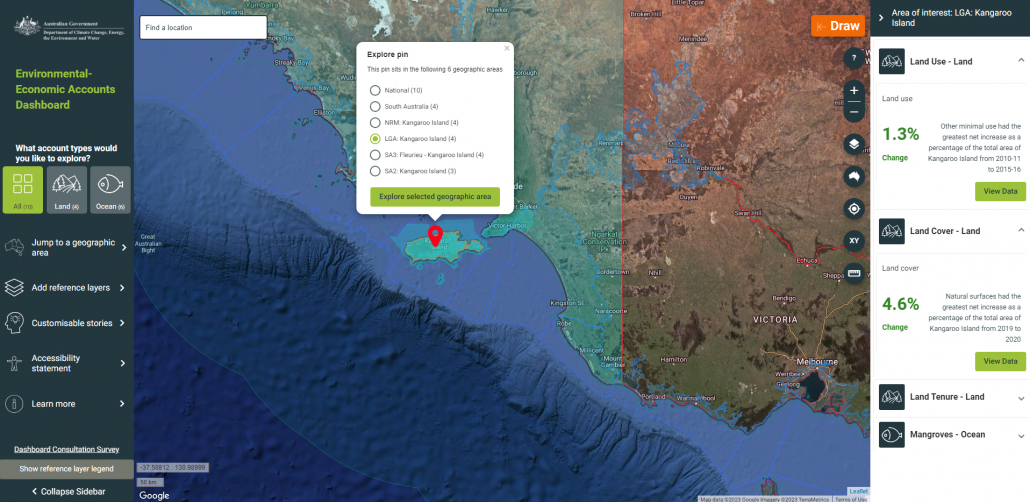
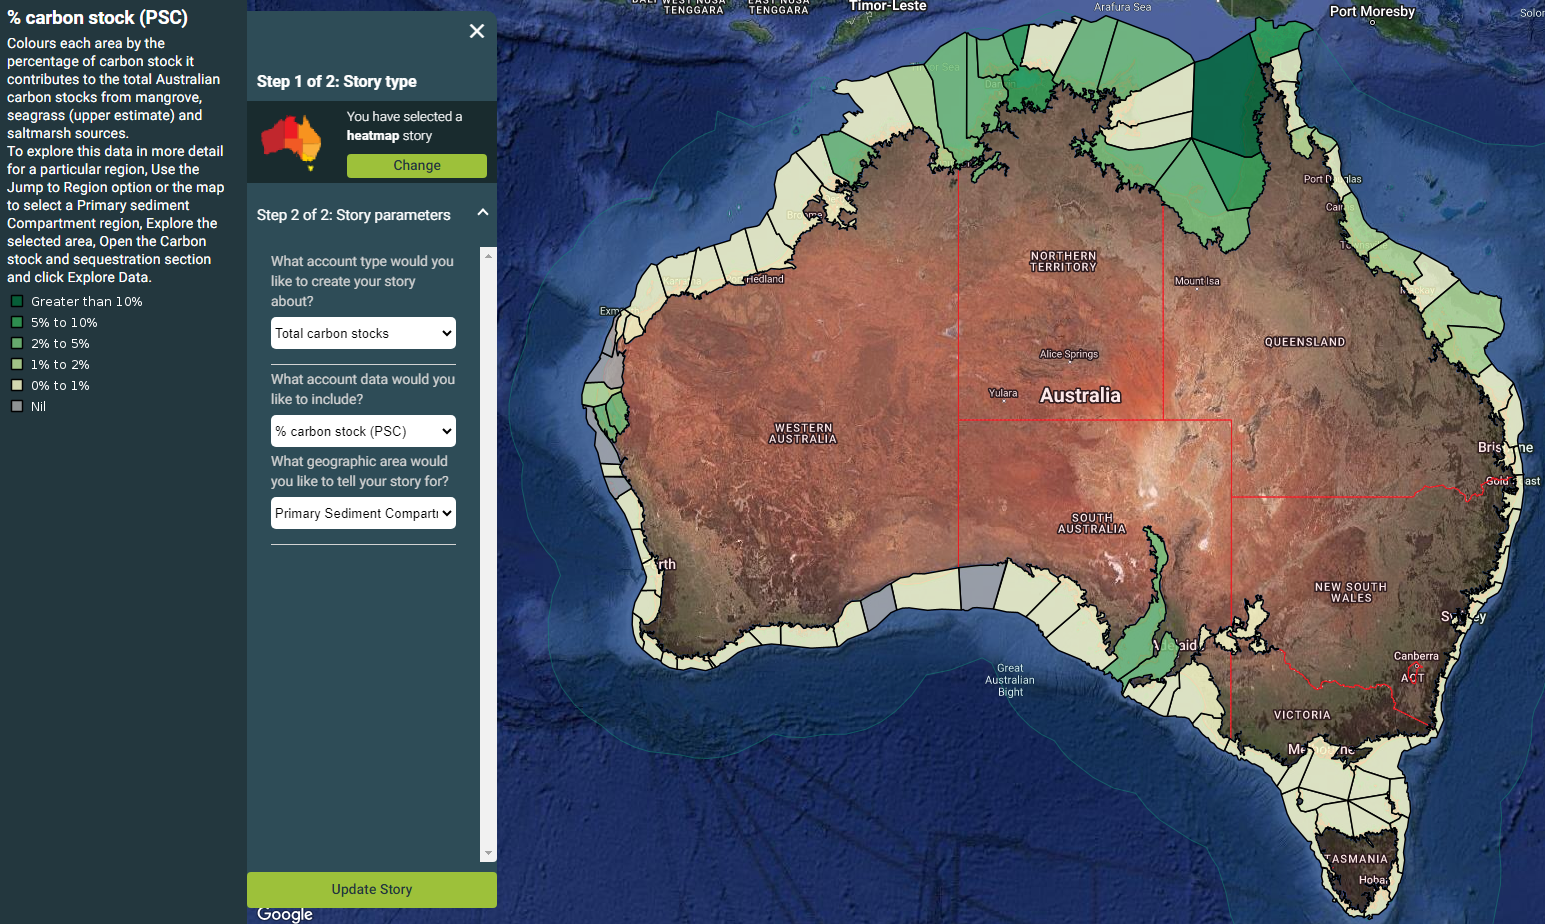
Following the ABS publishing approach, where key statistics and trends are called out, the Dashboard extracts and presents a series of statistics and customisable map stories which highlight trends and changes. However, these highlights are only the tip of the iceberg, with a wealth of underlying data available for the user to drill down into and explore in map, table and chart presentations.
Outcomes derived from the EEA Dashboard include;
- An understanding of how enhancing or degrading nature carries quantifiable benefits and costs otherwise invisible to or unaccounted for by decision-makers
- Highlighting the connection between nature and economy so that more holistic environmental assessments and the impact of a particular policy or decision
- The range of statistics, tables, charts and downloadable data cubes incorporated into the EEA Dashboard allows users to explore the EEA land and ocean account data more interactively, through maps, tables and charts.
- Data unlocked for large numbers of potential users with a desire to inform their policy and planning work so that environmental health is central
- Users lacking the tools, skills, or time are able to apply EEA accounting at a detailed and specific level, maximising the chance that environmental considerations will be at the heart of policy and planning
- A dynamic account generation process for a wider range of geographies relevant to a wide range of policy and planning activities undertaken by many national, state and local agencies
- Standardized account data enables users to understand where and how much land has moved between different land uses, covers, or tenures
- Customisable map stories that enable exploration of change in a variety of ways such as between different years, different land use, or which coastal areas contribute the highest percentage of carbon stock
- Exploration of the Dashboard’s rich data encouraged by offering key statistics for selected areas and data types and a button to deep dive into the data and investigate by table and chart


